You can view G/L budget data in three styles, each described below. The examples show only portions of the reports because you have to scroll down, to the right, or both to view entire reports.
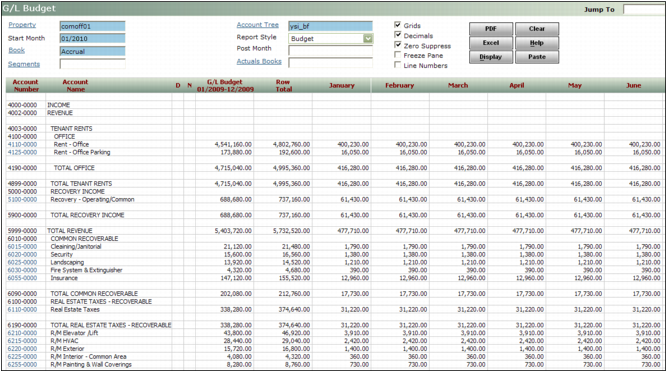
Budget Displays the amounts budgeted for each month during the budget year.
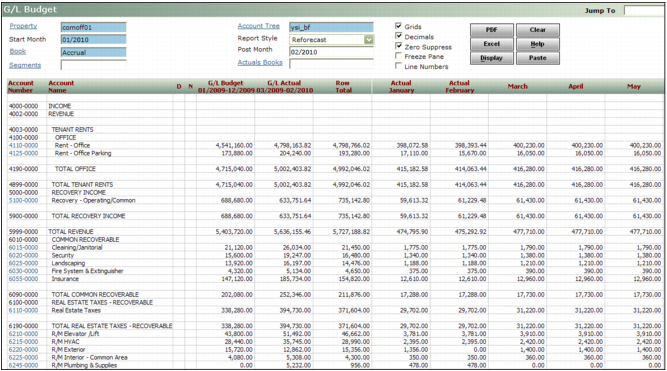
Reforecast Displays actual amounts for the post month and preceding months, and budgeted amounts for the remainder of the year. For example, if the start month is January and the post month is February, the report shows actual amounts for January and February, and budgeted amounts for March through December.
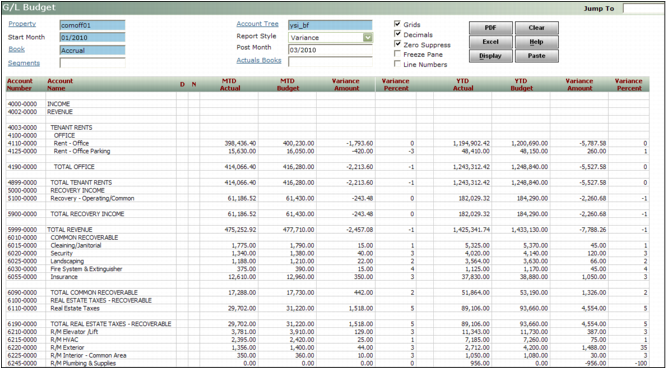
Variance Displays the actual and budgeted amounts, for both month-to-date (for the post month) and year-to-date (for the start month through the post month), with variance in both monetary amounts and percentages. For example, if the start month is January and the post month is March, the report displays the month-to-date actuals for March and the year-to-date for the year starting in January and ending in March.
|
1
|
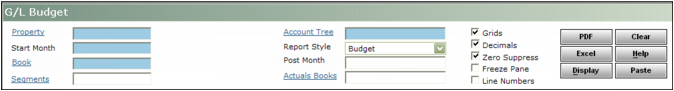
Property Select the code for the property.
Start Month Type the starting month and year.
Book Select the accounting book.
Segments If you use segmented accounting, click the Segments link and complete the Segment Selections screen.
|
|
Account Tree Select ysi_bf, the standard budget account tree provided with Voyager. Or, if your organization has set up a custom budget account tree, select that. The account tree determines which accounts appear in the budget table.
|
|
Report Style Select how you want columns to appear on the worksheet. See “Viewing G/L Budgets”.
Post Month If you are generating a Reforecast report, specify the first month for which you want to display the budgeted amount rather than the actual amount. If you are generating a Variance report, specify the month for the month-to-date part of the report.
Grids Displays gridlines.
Decimals Includes decimals and two digits to the right of the decimal on budget and reforecast reports. This option does not affect variance reports.
Zero Suppress Hides rows containing only zeroes. This reduces display time and simplifies detailed, complex budgets.
Freeze Pane Displays the budget worksheet in its own scrollable pane.
Line Numbers Displays line numbers.
|
4
|
Click Display. The budget table appears.
|
|
|
You must click Display to update the display after changing filter options or budget data.
|