Reports : Display Options

Display Options
This section describes the display option check boxes that appear in analytics report filters.
You determine the appearance of the report by selecting or clearing the display option check boxes. Not all check boxes are available for all reports. Sample reports showing each of the options appear below.
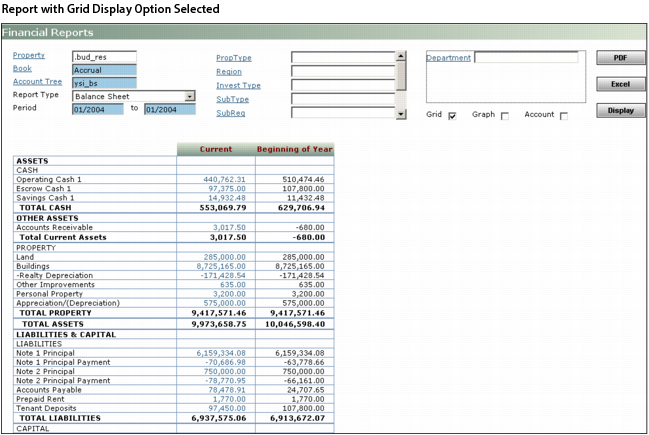
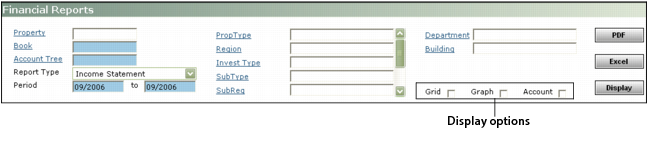
Grid Select this option to add grid lines in the spreadsheet part of the report.
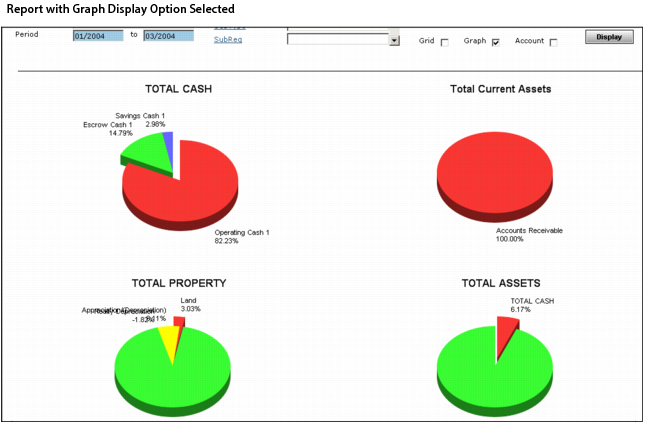
Graph Select this option to include pie charts and bar graphs above the spreadsheet part of the report.
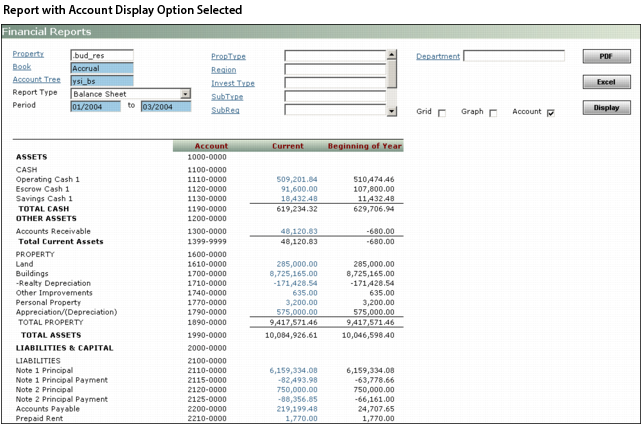
Account Select this option to display the relevant G/L account codes as part of the report.